Hello. This is codingwalks.
OpenCV is an image processing library that provides functions to easily draw various shapes and text on images. In this post, we will explain various functions for drawing lines and shapes (rectangles, circles, polygons, ellipses, etc.) and how to output text on images, and learn how to use them through example code. In order to easily implement a coordinate system for each axis, we will use matplotlib as a tool for drawing images. If you do not know how to use it, please refer to the post below.
Python Matplotlib Data Visualization - How to Use the imshow Function
Hello. This is codingwalks.In this article, we will introduce how to visualize image data using the imshow function of Matplotlib. Matplotlib's imshow is used to visualize image data or 2D arrays as color maps. With this fu
en.codingwalks.com
1. Drawing a line (cv2.line and cv2.clipLine)
1.1. Drawing a line (cv2.line)
A line is one of the most basic shapes. You can create an image and draw a line using the cv2.line function of OpenCV.
import cv2
from matplotlib import pyplot as plt
import numpy as np

# Create a blank image (black background)
image = np.zeros((512, 512, 3), np.uint8)
image = cv2.cvtColor(image, cv2.COLOR_BGR2RGB)

# Draw a line (start point (x1, y1), end point (x2, y2), color (BGR), thickness)
cv2.line(image, (100, 100), (400, 400), (0, 255, 0), 5)

plt.imshow(image)
plt.show()
• cv2.line(img, pt1, pt2, color, thickness)
• img: image
• pt1, pt2: coordinates of the start and end points of the line
• color: color of the line (BGR format)
• thickness: thickness of the line

1.2. Clipping a straight line (cv2.clipLine)
clipLine is a function that clips (cuts) a straight line so that it is visible only within a given rectangle.
import cv2
from matplotlib import pyplot as plt
import numpy as np

# Create a blank image (black background)
image = np.zeros((512, 512, 3), np.uint8)
image = cv2.cvtColor(image, cv2.COLOR_BGR2RGB)

# Draw a line only inside a rectangle
rect = (50, 50, 200, 200)  # Definition of a square (x, y, width, height)
p1 = (0, 0)
p2 = (400, 400)

inside, clipped_p1, clipped_p2 = cv2.clipLine(rect, p1, p2)

if inside:
    cv2.line(image, clipped_p1, clipped_p2, (0, 0, 255), 3)

plt.imshow(image)
plt.show()
• cv2.clipLine(rect, pt1, pt2)
• rect: Rectangular range (x, y, width, height) to clip the line
• pt1, pt2: Start and end points of the line
• Returns True if the line is within the rectangle, and the new start and end coordinates of the clipped line.

2. Drawing shapes
You can easily draw various shapes using OpenCV. Here, we will look at how to draw rectangles, circles, ovals, polygons, etc.
2.1. Drawing a rectangle (cv2.rectangle)
import cv2
from matplotlib import pyplot as plt
import numpy as np

# Create a blank image (black background)
image = np.zeros((512, 512, 3), np.uint8)
image = cv2.cvtColor(image, cv2.COLOR_BGR2RGB)

# Draw a rectangle
cv2.rectangle(image, (50, 50), (450, 450), (255, 0, 0), 3)

plt.imshow(image)
plt.show()
• cv2.rectangle(img, pt1, pt2, color, thickness)
• pt1: upper left coordinate of the rectangle
• pt2: lower right coordinate of the rectangle

2.2. Drawing a circle (cv2.circle)
import cv2
from matplotlib import pyplot as plt
import numpy as np

# Create a blank image (black background)
image = np.zeros((512, 512, 3), np.uint8)
image = cv2.cvtColor(image, cv2.COLOR_BGR2RGB)

# Draw a circle
cv2.circle(image, (256, 256), 100, (255, 0, 0), 3)

plt.imshow(image)
plt.show()
• cv2.circle(img, center, radius, color, thickness)
• center: center coordinate of the circle
• radius: radius of the circle
• thickness: thickness of the line, -1 means filling the interior

2.3. Drawing an ellipse (cv2.ellipse)
An ellipse can be drawn using the cv2.ellipse function. You can specify the center coordinates of the ellipse, the length of the major and minor axes, the angle, etc.
import cv2
from matplotlib import pyplot as plt
import numpy as np

# Create a blank image (black background)
image = np.zeros((512, 512, 3), np.uint8)
image = cv2.cvtColor(image, cv2.COLOR_BGR2RGB)

# Draw a ellipse
cv2.ellipse(image, (256, 256), (150, 100), 45, 0, 360, (255, 0, 0), 3)

plt.imshow(image)
plt.show()
• cv2.ellipse(img, center, axes, angle, startAngle, endAngle, color, thickness)
• center: Center coordinate of the ellipse
• axes: Major axis, minor axis of the ellipse
• angle: Rotation angle of the ellipse
• startAngle, endAngle: Angle range to draw the ellipse
• color: Color
• thickness: Thickness of the line

2.4. Drawing polygons (cv2.polylines)
import cv2
from matplotlib import pyplot as plt
import numpy as np

# Create a blank image (black background)
image = np.zeros((512, 512, 3), np.uint8)
image = cv2.cvtColor(image, cv2.COLOR_BGR2RGB)

# Set polygon coordinates
pts = np.array([[100, 50], [200, 300], [70, 200]], np.int32)
pts = pts.reshape((-1, 1, 2))

# Drawing a polygon
cv2.polylines(image, [pts], True, (255, 0, 0), 3)

plt.imshow(image)
plt.show()
• cv2.polylines(img, pts, isClosed, color, thickness)
• pts: List of vertex coordinates of polygons
• isClosed: If True, the shape is closed, if False, the shape is open

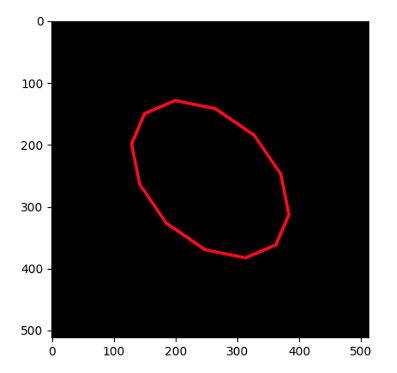
2.5. Generate Ellipse Polygon Coordinates (cv2.ellipse2Poly)
cv2.ellipse2Poly is a function that returns the coordinates of the vertices of an ellipse in the form of a polygon so that it can be drawn.
import cv2
from matplotlib import pyplot as plt
import numpy as np

# Create a blank image (black background)
image = np.zeros((512, 512, 3), np.uint8)
image = cv2.cvtColor(image, cv2.COLOR_BGR2RGB)

# Generate elliptical coordinates
ellipse_points = cv2.ellipse2Poly((256, 256), (150, 100), 45, 0, 360, 30)

# Drawing an ellipse with a polygon
cv2.polylines(image, [ellipse_points], True, (255, 0, 0), 3)

plt.imshow(image)
plt.show()
• cv2.ellipse2Poly(center, axes, angle, startAngle, endAngle, delta)
• delta: density of points according to angle interval
2.6. Filling a convex polygon (cv2.fillConvexPoly)
fillConvexPoly is used to fill a convex polygon with a color.
import cv2
from matplotlib import pyplot as plt
import numpy as np

# Create a blank image (black background)
image = np.zeros((512, 512, 3), np.uint8)
image = cv2.cvtColor(image, cv2.COLOR_BGR2RGB)

# Convex polygon coordinates
pts = np.array([[150, 100], [200, 200], [100, 300], [50, 200]], np.int32)
cv2.fillConvexPoly(image, pts, (0, 255, 0))

plt.imshow(image)
plt.show()
• cv2.fillConvexPoly(img, points, color)
• points: The vertex coordinates of the polygon

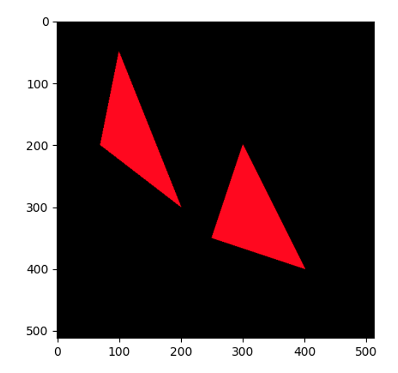
2.7. Filling polygons (cv2.fillPoly)
fillPoly is a function that can draw multiple polygons at once. Each polygon can be drawn in a different color.
import cv2
from matplotlib import pyplot as plt
import numpy as np

# Create a blank image (black background)
image = np.zeros((512, 512, 3), np.uint8)
image = cv2.cvtColor(image, cv2.COLOR_BGR2RGB)

# Polygon Coordinates
pts1 = np.array([[100, 50], [200, 300], [70, 200]], np.int32)
pts2 = np.array([[300, 200], [400, 400], [250, 350]], np.int32)

cv2.fillPoly(image, [pts1, pts2], (255, 0, 0))

plt.imshow(image)
plt.show()
• cv2.fillPoly(img, pts, color)
• pts: list of polygon vertex coordinates
3. Outputting a string (cv2.putText)
Putting text into an image is a useful function. You can annotate or add a description to an image using the cv2.putText function.
import cv2
from matplotlib import pyplot as plt
import numpy as np

# Create a blank image (black background)
image = np.zeros((512, 512, 3), np.uint8)
image = cv2.cvtColor(image, cv2.COLOR_BGR2RGB)

cv2.putText(image, 'OpenCV Drawing!', (50, 450), cv2.FONT_HERSHEY_SIMPLEX, 1, (255, 255, 255), 2)

plt.imshow(image)
plt.show()
• cv2.putText(img, text, org, font, fontScale, color, thickness)
• text: string to output
• org: coordinate where the text starts
• font: font style
• fontScale: text size
• color: text color
• thickness: text thickness

4. Conclusion
In this post, we looked at various drawing functions of OpenCV. From straight lines to polygons, ellipses, and text, you can easily implement various image processing using OpenCV. This will allow you to process image annotation work or graphical work more efficiently.
If you found this post useful, please like and subscribe below. ^^

[Codingwalks]에게 송금하기 - AQR
[Codingwalks]에게 송금하기 - AQR
aq.gy
★ All contents are referenced from the link below. ★
OpenCV: OpenCV-Python Tutorials
Core Operations In this section you will learn basic operations on image like pixel editing, geometric transformations, code optimization, some mathematical tools etc.
docs.opencv.org
'Lecture > OpenCV Master with Python (Beginner)' 카테고리의 다른 글
| OpenCV + Python Angle Measuring Instrument (Practical) (0) | 2024.10.23 |
|---|---|
| OpenCV + Python Outputting Unicode Fonts (0) | 2024.10.23 |
| OpenCV + Python Handling mouse and keyboard events and utilizing the trackbar (0) | 2024.10.23 |
| OpenCV + Python Processing images, videos, webcams, RTSP and RTMP streams (0) | 2024.10.23 |
| OpenCV + Python Introduction and installation process (0) | 2024.10.23 |


