Hello. This is codingwalks.
In this article, we will introduce how to visualize image data using the imshow function of Matplotlib. Matplotlib's imshow is used to visualize image data or 2D arrays as color maps. With this function, you can directly open and visualize image files, or display the distribution of data stored in an array as colors.
1. Install Matplotlib
You can check the installation method of matplotlib in the following article.
Python Matplotlib Data Visualization - Drawing Basic Graphs
Hello. This is codingwalks.There are many ways to visualize data in Python, but Matplotlib is one of the most widely used visualization libraries. In particular, it can easily draw various graphs such as bar graphs, line gr
en.codingwalks.com
In addition, the Pillow library is often used to process image files. Pillow is used to open, save, and edit image files. This library is also called the PIL module, and the following command is used to install it.
pip install Pillow
2. Visualizing images with the imshow function
2.1. Visualizing array data
First, let's visualize 2D array data with the imshow function. imshow expresses the values of the array as colors.
import matplotlib.pyplot as plt
import numpy as np

# Create 2D array data
data = np.random.rand(10, 10)

# Visualize array data with imshow
plt.imshow(data, cmap='viridis')

# Add colorbar
plt.colorbar()

plt.title("Random Data Visualization")
plt.show()
• np.random.rand(10, 10) generates a random array of size 10x10.
• imshow converts the array data into colors and visualizes them. cmap='viridis' is an option to set a color map. viridis is one of the commonly used color maps.
• plt.colorbar() adds a color bar based on color values to the graph.

2.2. Loading and visualizing an image file
Now let’s learn how to load an image file and output it with imshow. Here, we will use the Image module of the Pillow library to open an image file and visualize it with the imshow function of Matplotlib.
import matplotlib.pyplot as plt
from PIL import Image

# Load image file
image = Image.open('path_to_your_image.jpg')

# Visualize image with imshow
plt.imshow(image)

# Add title
plt.title("Image Visualization")

plt.axis('off')  # Remove axis
plt.show()
• Image.open() is a function that opens an image file, and stores the loaded image in the image variable.
• The imshow function displays the image on the screen.
• plt.axis('off') is a setting to hide the axis of the image. This is useful when you want to focus on the image itself.

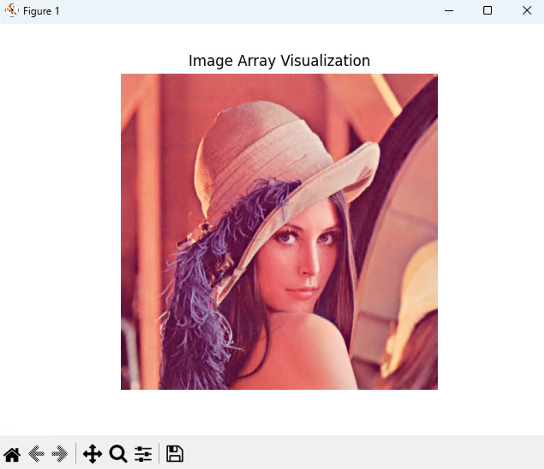
3. Convert image data to an array and visualize it
You can also convert the image loaded into the Pillow library into an array and then visualize it with imshow. This allows you to manipulate the image's pixel data as an array.
import matplotlib.pyplot as plt
import numpy as np
from PIL import Image

# Load image file
image = Image.open('path_to_your_image.jpg')

# Convert image to NumPy array
image_array = np.array(image)

# Visualize converted array with imshow
plt.imshow(image_array)

# Add title
plt.title("Image Array Visualization")
plt.axis('off')  # Remove axis

plt.show()
• np.array(image) is a function that converts an image to an array. This allows you to transform or analyze image data in various ways.
• The converted array can be visualized with imshow.
4. Setting a Color Map
The imshow function basically uses a color map to convert array data into colors. You can visually distinguish data through various color maps. Here are some examples of setting up some commonly used color maps.
import matplotlib.pyplot as plt
import numpy as np

# Create 2D array data
data = np.random.rand(10, 10)

# List of colormaps
colormaps = ['viridis', 'plasma', 'inferno', 'gray']

# Output multiple graphs
plt.figure(figsize=(10, 10))

for i, cmap in enumerate(colormaps):
    plt.subplot(2, 2, i+1)
    plt.imshow(data, cmap=cmap)
    plt.title(f"Colormap: {cmap}")
    plt.colorbar()

plt.tight_layout()
plt.show()
• You can set various colormaps using the cmap argument. In this example, we used viridis, plasma, inferno, and gray colormaps.
• Use plt.subplot() to output multiple graphs at the same time and apply different colormaps to each.

5. Conclusion
The imshow function is a powerful tool that can visualize not only image files but also array data in various ways. In particular, visualizing 2D array data using color maps is useful for clearly revealing the characteristics of the data. When used with the Pillow library, you can easily load and process image files or convert image data into arrays.
In this article, we learned how to use Matplotlib's imshow function and various image visualization methods. imshow is very useful for visually representing 2D data or images, and using color maps can help you understand the patterns of the data more easily.
If you found this post useful, please like and subscribe below. ^^

[Codingwalks]에게 송금하기 - AQR
[Codingwalks]에게 송금하기 - AQR
aq.gy
'Programming > Python' 카테고리의 다른 글
| Python Matplotlib Data Visualization - Drawing Basic Graphs (0) | 2024.10.23 |
|---|---|
| PyCharm Installation Guide (feat. Anaconda Interpreter) (0) | 2024.10.23 |
| Anaconda Installation Guide (feat. JupyterLab) (0) | 2024.10.23 |
| Python venv creation error (returned non-zero exit status 1.) (0) | 2024.10.23 |
| How to upgrade Python on Ubuntu (0) | 2024.10.22 |


