Hello. This is codingwalks.
There are many ways to visualize data in Python, but Matplotlib is one of the most widely used visualization libraries. In particular, it can easily draw various graphs such as bar graphs, line graphs, and scatter plots that can intuitively express the results of data analysis.
1. Install Matplotlib
Matplotlib can be easily installed via pip, the Python package manager. Install it by entering the following command in the terminal or command line.
pip install matplotlib
2. Matplotlib Basic Settings
Matplotlib consists of several modules, but we generally use the pyplot module to visualize data. First, import the pyplot module of Matplotlib.
import matplotlib.pyplot as pltTroubleshooting
The following error occurs when Python fails to load the compiled C extension (_cext) of the kiwisolver package. This can happen for a variety of reasons, including installation issues or missing dependencies.

1. Reinstall kiwisolver and matplotlib: Your kiwisolver installation may be corrupted, so try reinstalling it along with matplotlib to fix it.
pip uninstall kiwisolver matplotlib
pip install kiwisolver matplotlib
2. Install the Visual C++ Redistributable Package: Many Python C extensions require Microsoft Visual C++ Redistributable to be installed. Download and install the redistributable package from the Microsoft Download Center.
3. Drawing a basic graph
3.1. Line Plot
A line plot is useful for expressing changes in data over time. Let's draw a line plot using a simple example.
from matplotlib import pyplot as plt
import numpy as np

# Data Preparation
x = [1, 2, 3, 4, 5]
y = [2, 3, 5, 7, 11]

# Draw a line graph
plt.plot(x,y)

# Add title and axis labels
plt.title("Basic Line Plot")
plt.xlabel("X-axis")
plt.ylabel("Y-axis")

# Graph Output
plt.show()

The above code plots data on the X-axis and Y-axis, and creates a graph by connecting each data point with a line. plt.plot() is a function that draws a line graph.
3.2. Bar Chart
Bar charts are often used to visualize comparisons of categorical data.
import matplotlib.pyplot as plt

# Data Preparation
categories = ['A', 'B', 'C', 'D', 'E']
values = [5, 7, 3, 8, 4]

# Draw a bar graph
plt.bar(categories, values)

# Add title and axis labels
plt.title("Basic Bar Chart")
plt.xlabel("Category")
plt.ylabel("Values")

# Graph Output
plt.show()
plt.bar() is a function that draws a bar graph. It displays the height of each category value as a bar.
3.3. Scatter Plot
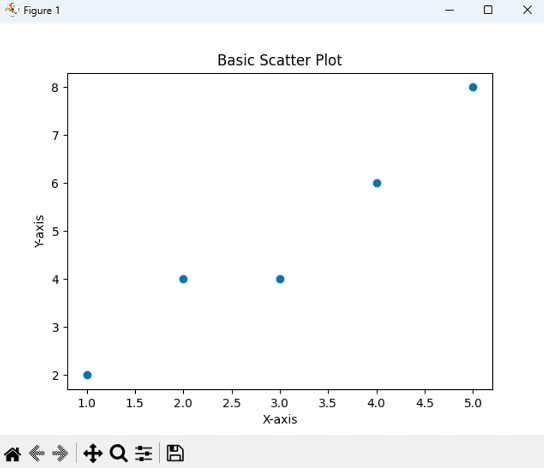
Scatter plots are useful for visualizing the relationship between two variables. Each data point is represented as a dot on a coordinate plane.
import matplotlib.pyplot as plt

# Data Preparation
x = [1, 2, 3, 4, 5]
y = [2, 4, 4, 6, 8]

# Draw a scatter plot
plt.scatter(x, y)

# Add title and axis labels
plt.title("Basic Scatter Plot")
plt.xlabel("X-axis")
plt.ylabel("Y-axis")

# Graph Output
plt.show()
plt.scatter() creates a scatter plot that plots data as points on the X and Y axes.
4. Customizing the Graph
4.1. Setting Line Styles, Colors, and Markers
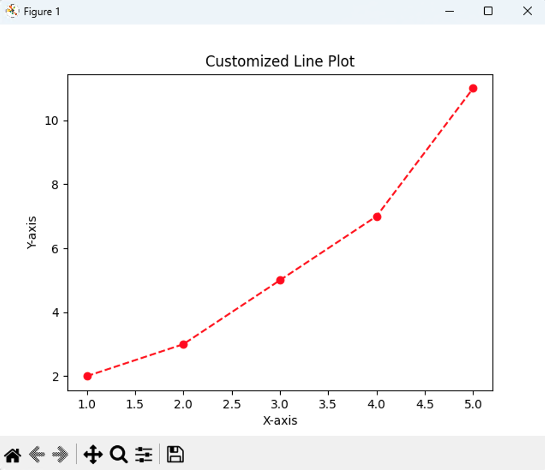
Matplotlib allows you to customize the line style, color, markers, etc. of a graph.
import matplotlib.pyplot as plt

# Data Preparation
x = [1, 2, 3, 4, 5]
y = [2, 3, 5, 7, 11]

# Draw customized line graphs
plt.plot(x, y, color='red', linestyle='--', marker='o')

# Add title and axis labels
plt.title("Customized Line Plot")
plt.xlabel("X-axis")
plt.ylabel("Y-axis")

# Graph Output
plt.show()
In this example, we set the line color to red (color='red'), the line style to dotted (linestyle='--'), and added a circular marker (marker='o') to each data point.
4.2. Adjusting the Graph Size
You can adjust the size of the graph using the figsize parameter.
import matplotlib.pyplot as plt

# Data Preparation
x = [1, 2, 3, 4, 5]
y = [2, 3, 5, 7, 11]

# Set graph size
plt.figure(figsize=(10, 5))

# Draw a line graph
plt.plot(x, y)

# Add title and axis labels
plt.title("Line Plot with Customized Size")
plt.xlabel("X-axis")
plt.ylabel("Y-axis")

# Graph Output
plt.show()
You can adjust the size of the graph by passing a value in the format figsize=(width, height) to plt.figure().
5. Drawing Multiple Graphs
Matplotlib allows you to draw multiple graphs in one window.
import matplotlib.pyplot as plt

# Data Preparation
x = [1, 2, 3, 4, 5]
y1 = [2, 3, 5, 7, 11]
y2 = [1, 4, 6, 8, 10]

# Draw two line graphs
plt.plot(x, y1, label="Line 1")
plt.plot(x, y2, label="Line 2")

# Add legend
plt.legend()

# Add title and axis labels
plt.title("Multiple Line Plot")
plt.xlabel("X-axis")
plt.ylabel("Y-axis")

# Graph Output
plt.show()
Here we have overlaid two line graphs. The plt.legend() function adds a legend to explain what each graph represents.
6. Conclusion
Matplotlib is a great tool to start with simple visualizations. In this article, we have covered basic graphs such as line graphs, bar graphs, and scatter plots, and learned how to customize the graphs with various styles and options. Now you can use Matplotlib to better understand your data and communicate your analysis results visually and effectively.
If you found this post useful, please like and subscribe below. ^^

[Codingwalks]에게 송금하기 - AQR
[Codingwalks]에게 송금하기 - AQR
aq.gy
'Programming > Python' 카테고리의 다른 글
| Python Matplotlib Data Visualization - How to Use the imshow Function (0) | 2024.10.23 |
|---|---|
| PyCharm Installation Guide (feat. Anaconda Interpreter) (0) | 2024.10.23 |
| Anaconda Installation Guide (feat. JupyterLab) (0) | 2024.10.23 |
| Python venv creation error (returned non-zero exit status 1.) (0) | 2024.10.23 |
| How to upgrade Python on Ubuntu (0) | 2024.10.22 |


